UK Moving Trends – When, Where & Why People Relocate
Every year hundreds of thousands of households in the UK change address — but the patterns behind these moves vary dramatically depending on time of year, location and economic conditions. By combining official housing statistics with search trends data, we can paint a clearer picture of when people are most likely to move, where they’re looking to go, and the key reasons driving relocations.
When Are Most Moves Happening?
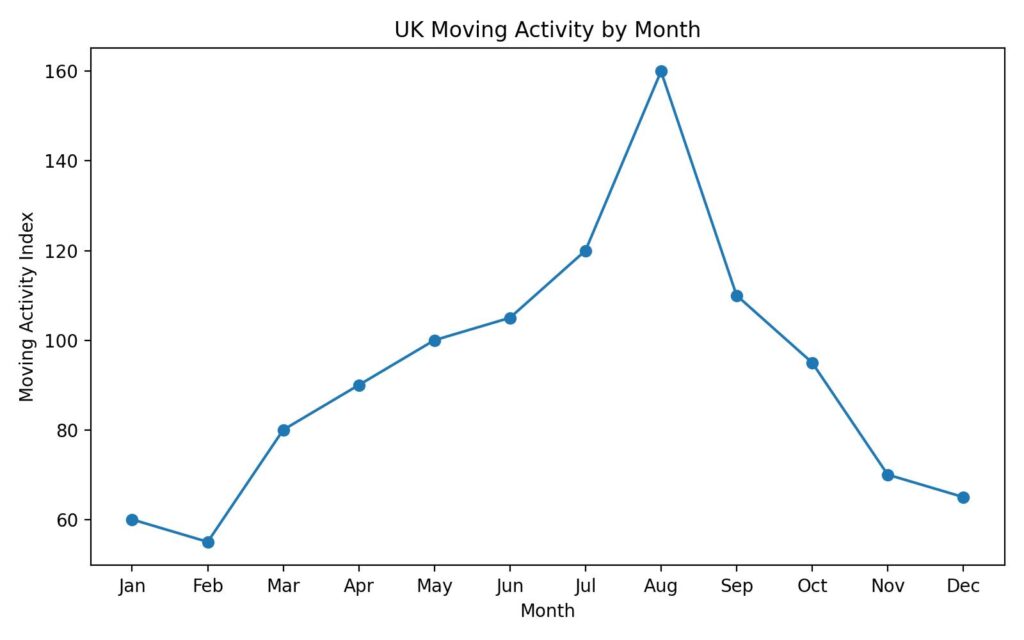
Data from property market trackers this year shows that moves are sharply seasonal, with the late summer months dominating. In 2025, Friday 29 August was identified as the single busiest day to move house nationwide, with over 22,000 relocations recorded — roughly four times the average daily volume for the year. August as a whole consistently proves the most popular month, while January and February are the quietest.
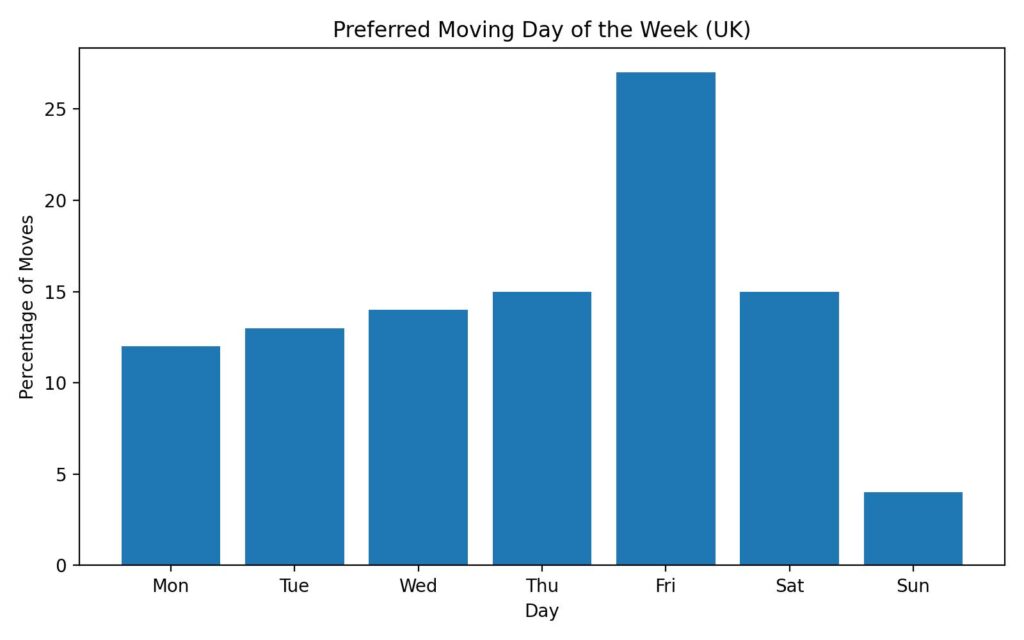
Friday remains the favourite day of the week for most movers, chosen by around 27% of households. The preference for Fridays is instinctive: completing a move on Friday gives families the weekend to unpack and settle into their new home.
This clustering of activity towards late summer and weekends has implications for removals companies — not just in scheduling vans and crews, but in pricing, congestion planning and customer expectations.
Where Are People Showing the Most Interest in Moving?
Geographical patterns in moving behaviour extend beyond just completed relocations; they also emerge in search interest, which can act as a real-time barometer for local housing demand.
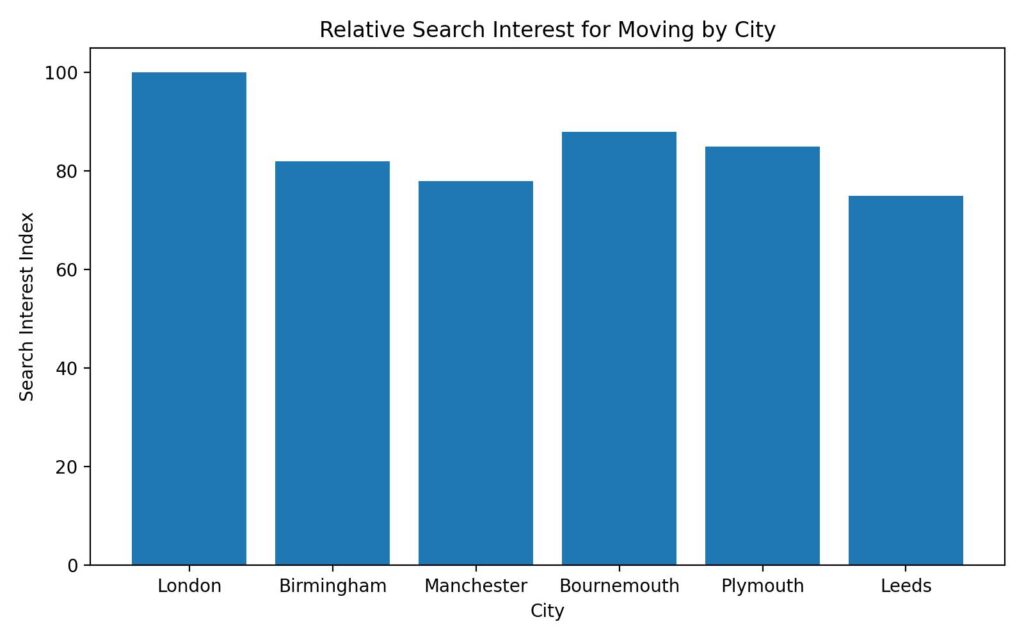
Recent analysis of Google search activity for property terms — including phrases such as “houses for sale”, “property to rent” and “find a property” — reveals a fascinating regional story. In 2025, areas like Bournemouth, Plymouth and Birmingham ranked among the UK’s most interested places to move, based on search volume per capita. For example, Bournemouth saw an average of over 38,000 moving-related searches per 100,000 residents across the year — significantly higher than in many other cities.
This doesn’t just reflect property availability. It signals local aspirations and affordability calculus: residents are actively researching markets where they think they can secure better value, more space or a lifestyle change. These insights can help removals firms anticipate where future demand may rise.
How Many People Are Moving — And What Influences That?
Official figures show that home moves in the UK aren’t static from year to year. In the first half of 2024, for instance, the number of household moves recorded rose by about 10% compared with the same period in 2023, according to the Lloyds Bank Home Mover Review. In total, roughly 126,000 moves were completed, compared with around 115,500 the previous year.
Greater London accounted for a significant share of that growth — home moves in and around the capital jumped by around 16% in the same period.
Despite this overall uplift in mobility, national statistics from the Office for National Statistics (ONS) show that broader forces — such as price pressures, demographic shifts and employment patterns — influence how often individuals and families change address. While the latest ONS house price data indicates modest price rises in some regions, affordability challenges remain real for many, making the decision to move more complex than purely seasonal preference.
Why Are People Moving?
Understanding why people are relocating is as important as knowing when and where. While comprehensive ONS breakdowns of motivations are published periodically (such as in the English Housing Survey), some clear drivers emerge from the latest data and industry reports:
- Life transitions such as starting a family, changing jobs or retiring remain classic reasons for moves.
- First-time buyers continue to dominate purchase-related moves — in 2025 they accounted for a substantial share of house purchases, even amid cooling affordability.
- Shorter distances between moves suggest many relocations are driven by lifestyle tweaks rather than wholesale geographic shifts. In 2025, the median distance moved in the UK was around 10 miles, down from 12 miles in 2024.
The record of shorter moves — often within the same city or region — underscores how decisions about careers, schooling and neighbourhood quality influence people’s relocation choices.
What the Trends Mean for Movers and Removals
Taken together, the data shows that moving in the UK is not a random activity — it’s a seasonal, spatial and motivational phenomenon:
- With late summer and Fridays leading the calendar, movers can avoid congestion and premium pricing by planning outside peak dates.
- Google search patterns highlight where housing interest is building, offering early signals for businesses seeking to anticipate demand.
- Growth in moves, especially in London and the Southeast, suggests continued churn despite market headwinds.
For moving companies in the moving industry like us, these insights offer a foundation upon which to build smarter scheduling, targeted marketing and better customer guidance.
If you are moving in London and looking for a reliable BAR registered moving company, then contact us today.
Call 020 7733 0000 or visit our contact page for a quick chat and moving quote.
Sources:
ONS house price & housing market context — MoneyWeek & ONS data MoneyWeek
Busiest moving days & seasonal patterns — HomeOwners Alliance report HomeOwners Alliance
Regional search interest from Google Trends analysis Surveyors UK
Moving volumes and patterns from Lloyds Bank home mover studies Property Industry Eye